An outline of all sections included in this SRS is recorded here for easy reference.
This section records information for easy reference.
The unit system used throughout is SI (Système International d'Unités). In addition to the basic units, several derived units are also used. For each unit, the Table of Units lists the symbol, a description, and the SI name.
Symbol | Description | SI Name |
---|---|---|
kg | mass | kilogram |
m | length | metre |
N | force | newton |
Pa | pressure | pascal |
s | time | second |
The symbols used in this document are summarized in the Table of Symbols along with their units. The symbols are listed in alphabetical order.
Symbol | Description | Units |
---|---|---|
a | Plate length (long dimension) | m |
AR | Aspect ratio | -- |
ARmax | Maximum aspect ratio | -- |
B | Risk of failure | -- |
b | Plate width (short dimension) | m |
capacity | Capacity or load resistance | Pa |
dmax | Maximum value for one of the dimensions of the glass plate | m |
dmin | Minimum value for one of the dimensions of the glass plate | m |
E | Modulus of elasticity of glass | Pa |
g | Glass type | -- |
GTF | Glass type factor | -- |
h | Minimum thickness | m |
interpY | InterpY | -- |
interpZ | InterpZ | -- |
isSafeLoad | Load resistance safety requirement | -- |
isSafeLR | 3 second load equivalent resistance safety requirement | -- |
isSafePb | Probability of glass breakage safety requirement | -- |
isSafeProb | Probability of failure safety requirement | -- |
J | Stress distribution factor (Function) | -- |
Jmax | Maximum value for the stress distribution factor | -- |
Jmin | Minimum value for the stress distribution factor | -- |
Jtol | Tolerable stress distribution factor | -- |
k | Surface flaw parameter | \(\frac{\text{m}^{12}}{\text{N}^{7}}\) |
LDF | Load duration factor | -- |
Load | Applied load (demand) or pressure | Pa |
LR | Load resistance | Pa |
LSF | Load share factor | -- |
m | Surface flaw parameter | \(\frac{\text{m}^{12}}{\text{N}^{7}}\) |
NFL | Non-factored load | Pa |
Pb | Probability of breakage | -- |
Pbtol | Tolerable probability of breakage | -- |
Pf | Probability of failure | -- |
Pftol | Tolerable probability of failure | -- |
q | Applied load (demand) | Pa |
q̂ | Dimensionless load | -- |
q̂tol | Tolerable load | -- |
SD | Stand off distance | m |
SDmax | Maximum stand off distance permissible for input | m |
SDmin | Minimum stand off distance permissible for input | m |
SDx | Stand off distance (x-component) | m |
SDy | Stand off distance (y-component) | m |
SDz | Stand off distance (z-component) | m |
t | Nominal thickness t ∈ {2.5,2.7,3.0,4.0,5.0,6.0,8.0,10.0,12.0,16.0,19.0,22.0} | mm |
td | Duration of load | s |
TNT | TNT equivalent factor | -- |
w | Charge weight | kg |
wmax | Maximum permissible input charge weight | kg |
wmin | Minimum permissible input charge weight | kg |
wTNT | Equivalent TNT charge mass | kg |
Abbreviation | Full Form |
---|---|
A | Assumption |
AN | Annealed |
AR | Aspect Ratio |
DD | Data Definition |
FT | Fully Tempered |
GS | Goal Statement |
GTF | Glass Type Factor |
HS | Heat Strengthened |
IG | Insulating Glass |
IM | Instance Model |
LC | Likely Change |
LDF | Load Duration Factor |
LG | Laminated Glass |
LR | Load Resistance |
LSF | Load Share Factor |
N/A | Not Applicable |
NFL | Non-Factored Load |
PS | Physical System Description |
R | Requirement |
RefBy | Referenced by |
Refname | Reference Name |
SD | Stand Off Distance |
SRS | Software Requirements Specification |
TM | Theoretical Model |
UC | Unlikely Change |
Uncert. | Typical Uncertainty |
Software is helpful to efficiently and correctly predict the blast risk involved with the glass slab. The blast under consideration is any kind of man-made explosion. The software, herein called GlassBR, aims to predict the blast risk involved with the glass slab using an intuitive interface.
The following section provides an overview of the Software Requirements Specification (SRS) for GlassBR. This section explains the purpose of this document, the scope of the requirements, the characteristics of the intended reader, and the organization of the document.
The primary purpose of this document is to record the requirements of GlassBR. Goals, assumptions, theoretical models, definitions, and other model derivation information are specified, allowing the reader to fully understand and verify the purpose and scientific basis of GlassBR. With the exception of system constraints, this SRS will remain abstract, describing what problem is being solved, but not how to solve it.
This document will be used as a starting point for subsequent development phases, including writing the design specification and the software verification and validation plan. The design document will show how the requirements are to be realized, including decisions on the numerical algorithms and programming environment. The verification and validation plan will show the steps that will be used to increase confidence in the software documentation and the implementation. Although the SRS fits in a series of documents that follow the so-called waterfall model, the actual development process is not constrained in any way. Even when the waterfall model is not followed, as Parnas and Clements point out parnasClements1986, the most logical way to present the documentation is still to "fake" a rational design process.
The scope of the requirements includes determining the safety of a glass slab under a blast loading following the ASTM standard (astm2009).
Reviewers of this documentation should have an understanding of second year calculus, structural mechanics, glass breakage, blast risk, computer applications in civil engineering, and applicable standards for constructions using glass from astm2009, astm2012, and astm2016 in references. The users of GlassBR can have a lower level of expertise, as explained in Sec:User Characteristics.
The organization of this document follows the template for an SRS for scientific computing software proposed by koothoor2013, smithLai2005, smithEtAl2007, and smithKoothoor2016. The presentation follows the standard pattern of presenting goals, theories, definitions, and assumptions. For readers that would like a more bottom up approach, they can start reading the data definitions and trace back to find any additional information they require.
The goal statements are refined to the theoretical models and the theoretical models to the instance models. The data definitions are used to support the definitions of the different models.
This section describes the stakeholders: the people who have an interest in the product.
The client for GlassBR is a company named Entuitive. It is developed by Dr. Manuel Campidelli. The client has the final say on acceptance of the product.
The customers are the end user of GlassBR.
This section provides general information about the system. It identifies the interfaces between the system and its environment, describes the user characteristics, and lists the system constraints.
Fig:sysCtxDiag shows the system context. A circle represents an external entity outside the software, the user in this case. A rectangle represents the software system itself (GlassBR). Arrows are used to show the data flow between the system and its environment.
The interaction between the product and the user is through a user interface. The responsibilities of the user and the system are as follows:
There are no system constraints.
This section first presents the problem description, which gives a high-level view of the problem to be solved. This is followed by the solution characteristics specification, which presents the assumptions, theories, and definitions that are used.
A system is needed to predict whether a glass slab can withstand a blast under given conditions.
This subsection provides a list of terms that are used in the subsequent sections and their meaning, with the purpose of reducing ambiguity and making it easier to correctly understand the requirements. All of the terms are extracted from astm2009.
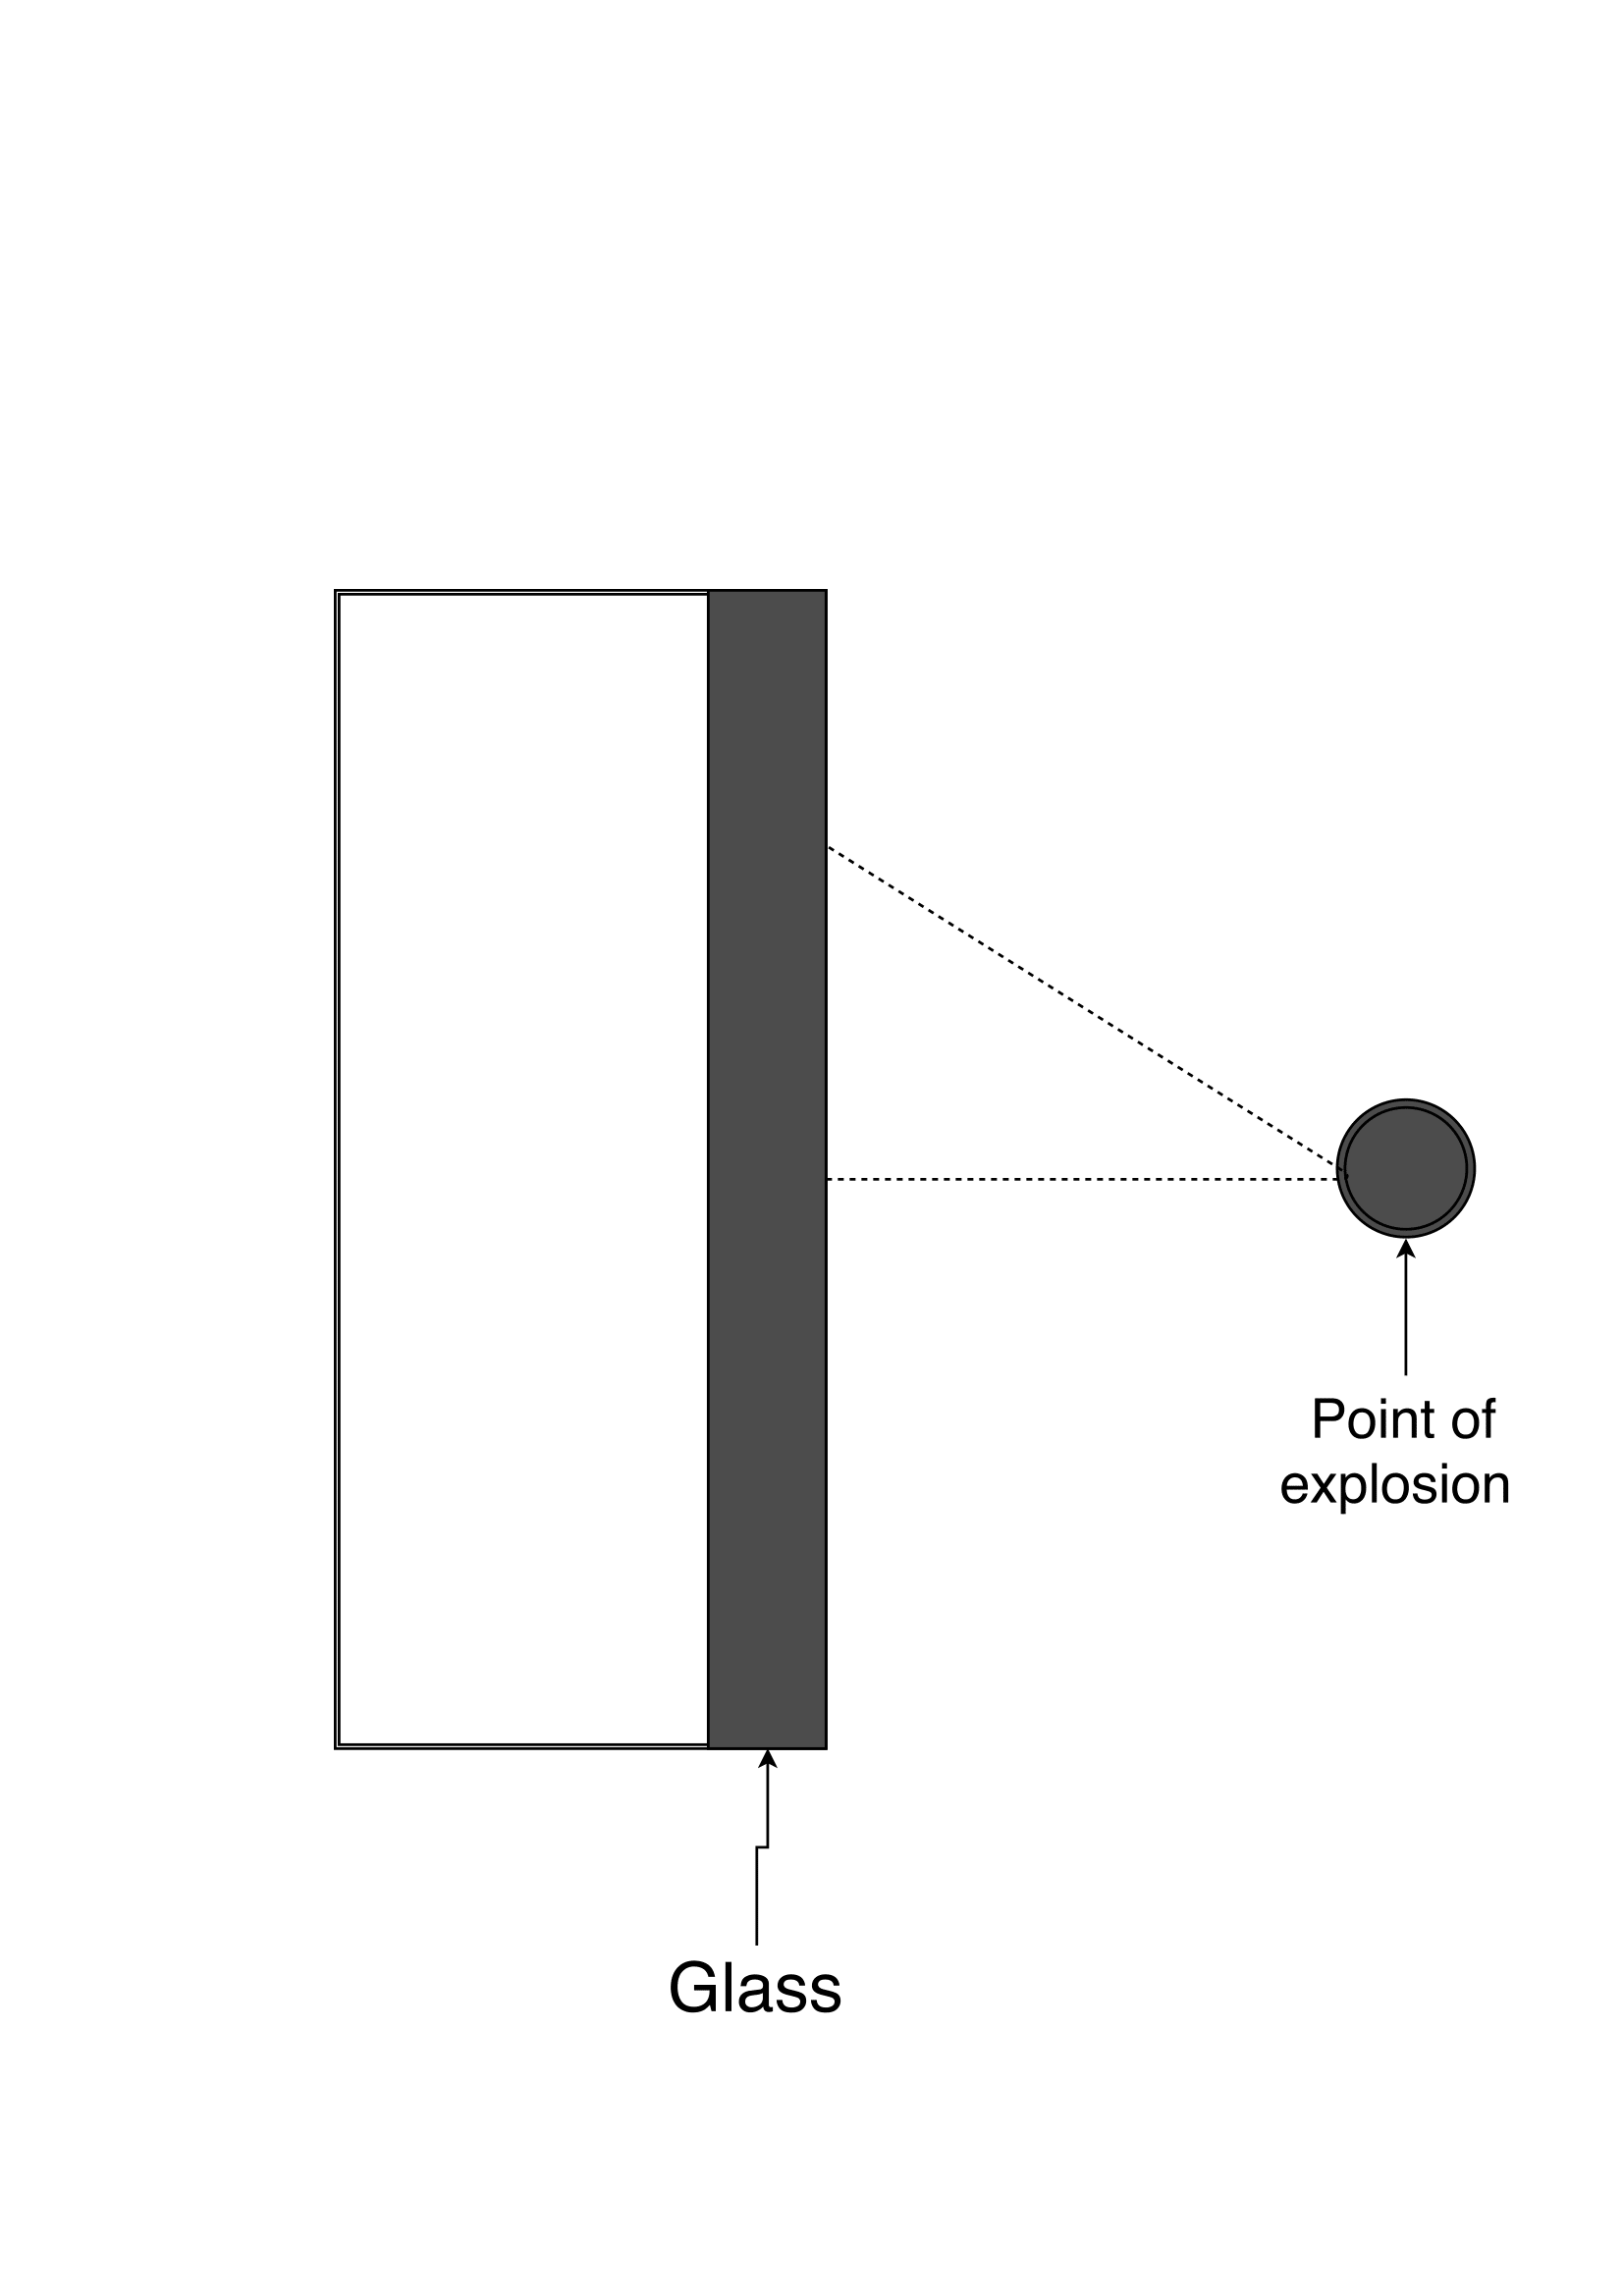
The physical system of GlassBR, as shown in Fig:physSystImage, includes the following elements:
PS1: The glass slab.
PS2: The point of explosion. Where the bomb, or any kind of man-made explosion, is located. The stand off distance is the distance between the point of explosion and the glass.
Given the dimensions of the glass plane, the glass type, the characteristics of the explosion, and the tolerable probability of breakage, the goal statement is:
The instance models that govern GlassBR are presented in the Instance Model Section. The information to understand the meaning of the instance models and their derivation is also presented, so that the instance models can be verified.
This section simplifies the original problem and helps in developing the theoretical models by filling in the missing information for the physical system. The assumptions refine the scope by providing more detail.
This section focuses on the general equations and laws that GlassBR is based on.
Refname | TM:isSafeProb |
---|---|
Label | Safety Probability |
Equation | \[\mathit{isSafeProb}={P_{\text{f}}}\lt{}{P_{\text{f}\text{tol}}}\] |
Description | |
Notes |
If isSafeProb, the structure is considered safe. |
Source | |
RefBy |
Refname | TM:isSafeLoad |
---|---|
Label | Safety Load |
Equation | \[\mathit{isSafeLoad}=\mathit{capacity}\gt{}\mathit{Load}\] |
Description | |
Notes |
If isSafeLoad, the structure is considered safe. |
Source | |
RefBy |
There are no general definitions.
This section collects and defines all the data needed to build the instance models.
Refname | DD:minThick |
---|---|
Label | Minimum thickness |
Symbol | h |
Units | m |
Equation | \[h=\frac{1}{1000} \begin{cases} 2.16, & t=2.5\\ 2.59, & t=2.7\\ 2.92, & t=3.0\\ 3.78, & t=4.0\\ 4.57, & t=5.0\\ 5.56, & t=6.0\\ 7.42, & t=8.0\\ 9.02, & t=10.0\\ 11.91, & t=12.0\\ 15.09, & t=16.0\\ 18.26, & t=19.0\\ 21.44, & t=22.0 \end{cases}\] |
Description | |
Notes |
t is a function that maps from the nominal thickness (h) to the minimum thickness. |
Source | |
RefBy |
IM:sdfTol, IM:riskFun, IM:nFL, and IM:dimlessLoad |
Refname | DD:loadDurFactor |
---|---|
Label | Load duration factor |
Symbol | LDF |
Units | Unitless |
Equation | \[\mathit{LDF}=\left(\frac{{t_{\text{d}}}}{60}\right)^{\frac{m}{16}}\] |
Description | |
Notes |
td and m come from A:standardValues. LDF is assumed to be constant (from A:ldfConstant). |
Source | |
RefBy |
IM:sdfTol and IM:riskFun |
Refname | DD:gTF |
---|---|
Label | Glass type factor |
Symbol | GTF |
Units | Unitless |
Equation | \[\mathit{GTF}=\begin{cases} 1, & g=\text{``AN''}\\ 4, & g=\text{``FT''}\\ 2, & g=\text{``HS''} \end{cases}\] |
Description | |
Notes |
AN is annealed glass. FT is fully tempered glass. HS is heat strengthened glass. |
Source | |
RefBy |
Refname | DD:standOffDist |
---|---|
Label | Stand off distance |
Symbol | SD |
Units | m |
Equation | \[\mathit{SD}=\sqrt{{\mathit{SD}_{\text{x}}}^{2}+{\mathit{SD}_{\text{y}}}^{2}+{\mathit{SD}_{\text{z}}}^{2}}\] |
Description | |
Source | |
RefBy |
Refname | DD:aspectRatio |
---|---|
Label | Aspect ratio |
Symbol | AR |
Units | Unitless |
Equation | \[\mathit{AR}=\frac{a}{b}\] |
Description | |
Notes |
a and b are the dimensions of the plate, where (a ≥ b). |
Source | |
RefBy |
Refname | DD:eqTNTW |
---|---|
Label | Equivalent TNT charge mass |
Symbol | wTNT |
Units | kg |
Equation | \[{w_{\mathit{TNT}}}=w \mathit{TNT}\] |
Description | |
Source | |
RefBy |
Refname | DD:calofDemand |
---|---|
Label | Applied load (demand) |
Symbol | q |
Units | Pa |
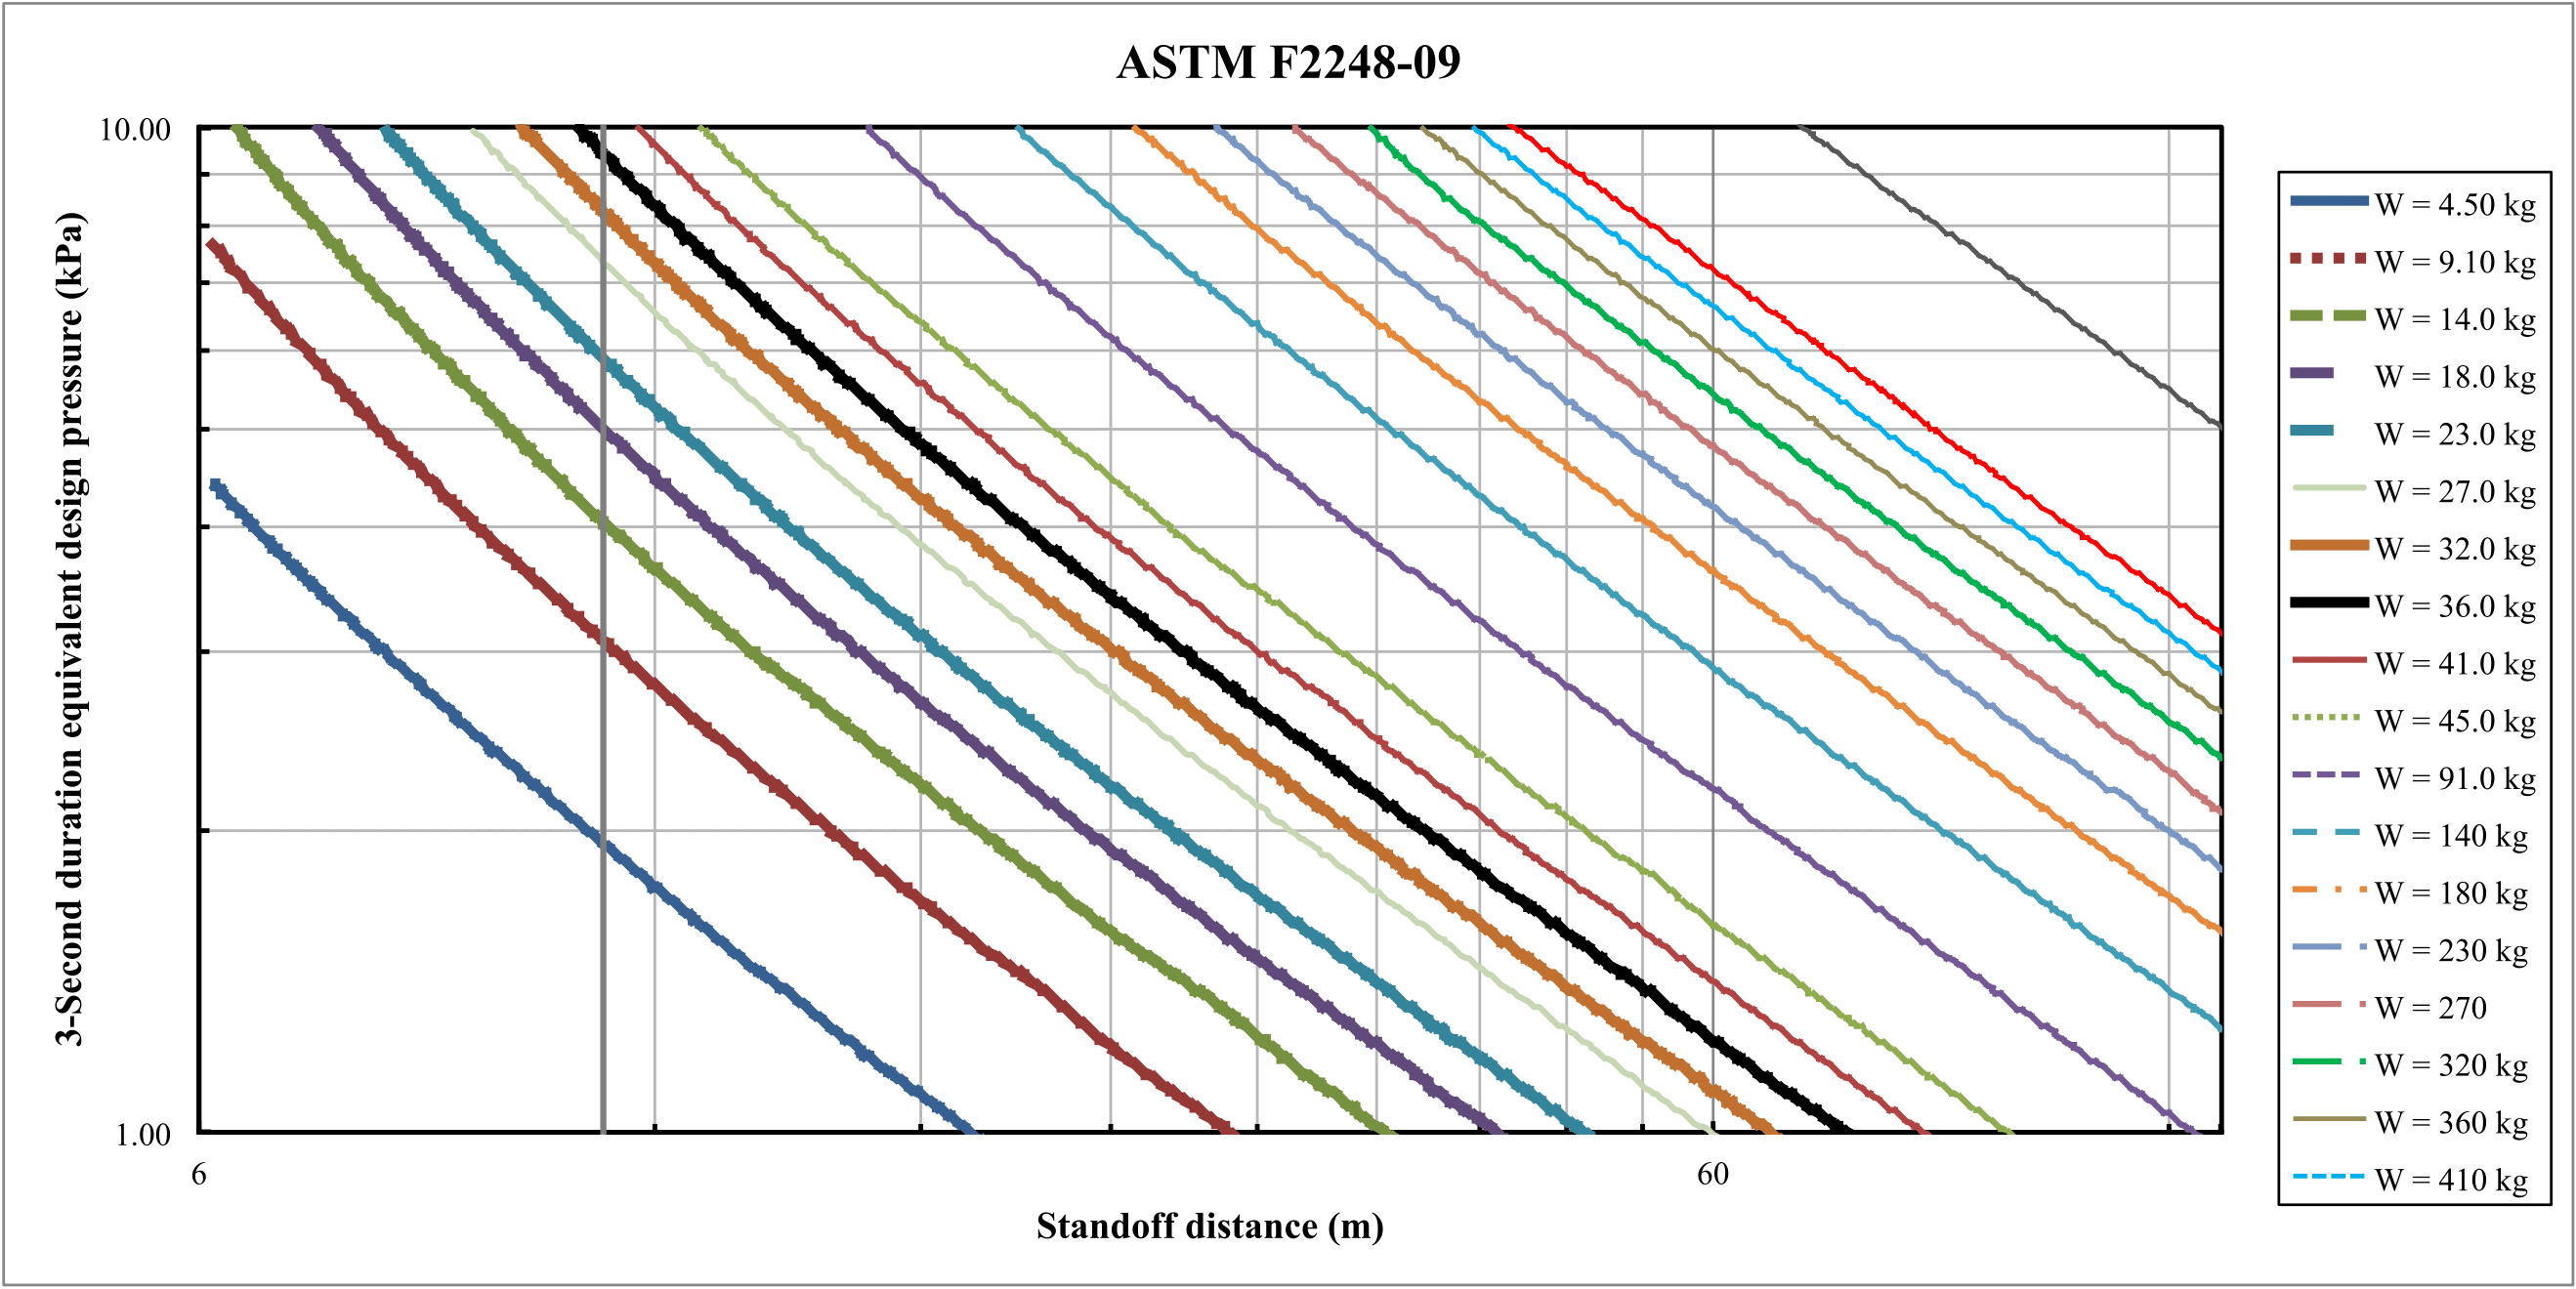
Equation | \[q=\mathit{interpY}\left(\text{``TSD.txt''},\mathit{SD},{w_{\mathit{TNT}}}\right)\] |
Description | |
Notes |
q, or applied load (demand), is the 3 second duration equivalent pressure obtained from Fig:demandVSsod by interpolation using stand off distance (SD) and wTNT as parameters. wTNT is defined in DD:eqTNTW. SD is the stand off distance as defined in DD:standOffDist. |
Source | |
RefBy |
This section transforms the problem defined in the problem description into one which is expressed in mathematical terms. It uses concrete symbols defined in the data definitions to replace the abstract symbols in the models identified in theoretical models and general definitions.
The goal GS:Predict-Glass-Withstands-Explosion is met by IM:isSafePb, IM:isSafeLR.
Refname | IM:riskFun |
---|---|
Label | Risk of failure |
Input |
E, LDF, J, k, m, h, a, b |
Output | B |
Input Constraints | \[a\gt{}0\] \[0\lt{}b\leq{}a\] |
Output Constraints | |
Equation | \[B=\frac{k}{\left(a b\right)^{m-1}} \left(E h^{2}\right)^{m} \mathit{LDF} e^{J}\] |
Description | |
Notes |
a and b are the dimensions of the plate, where (a ≥ b). h is defined in DD:minThick and is based on the nominal thicknesses. LDF is defined in DD:loadDurFactor. J is defined in IM:stressDistFac. |
Source |
astm2009, beasonEtAl1998 (Eqs. 4-5), and campidelli (Eq. 14) |
RefBy |
Refname | IM:stressDistFac |
---|---|
Label |
Stress distribution factor (Function) |
Input | AR, q̂ |
Output | J |
Input Constraints | \[\mathit{AR}\geq{}1\] |
Output Constraints | \[{J_{\text{min}}}\leq{}J\leq{}{J_{\text{max}}}\] |
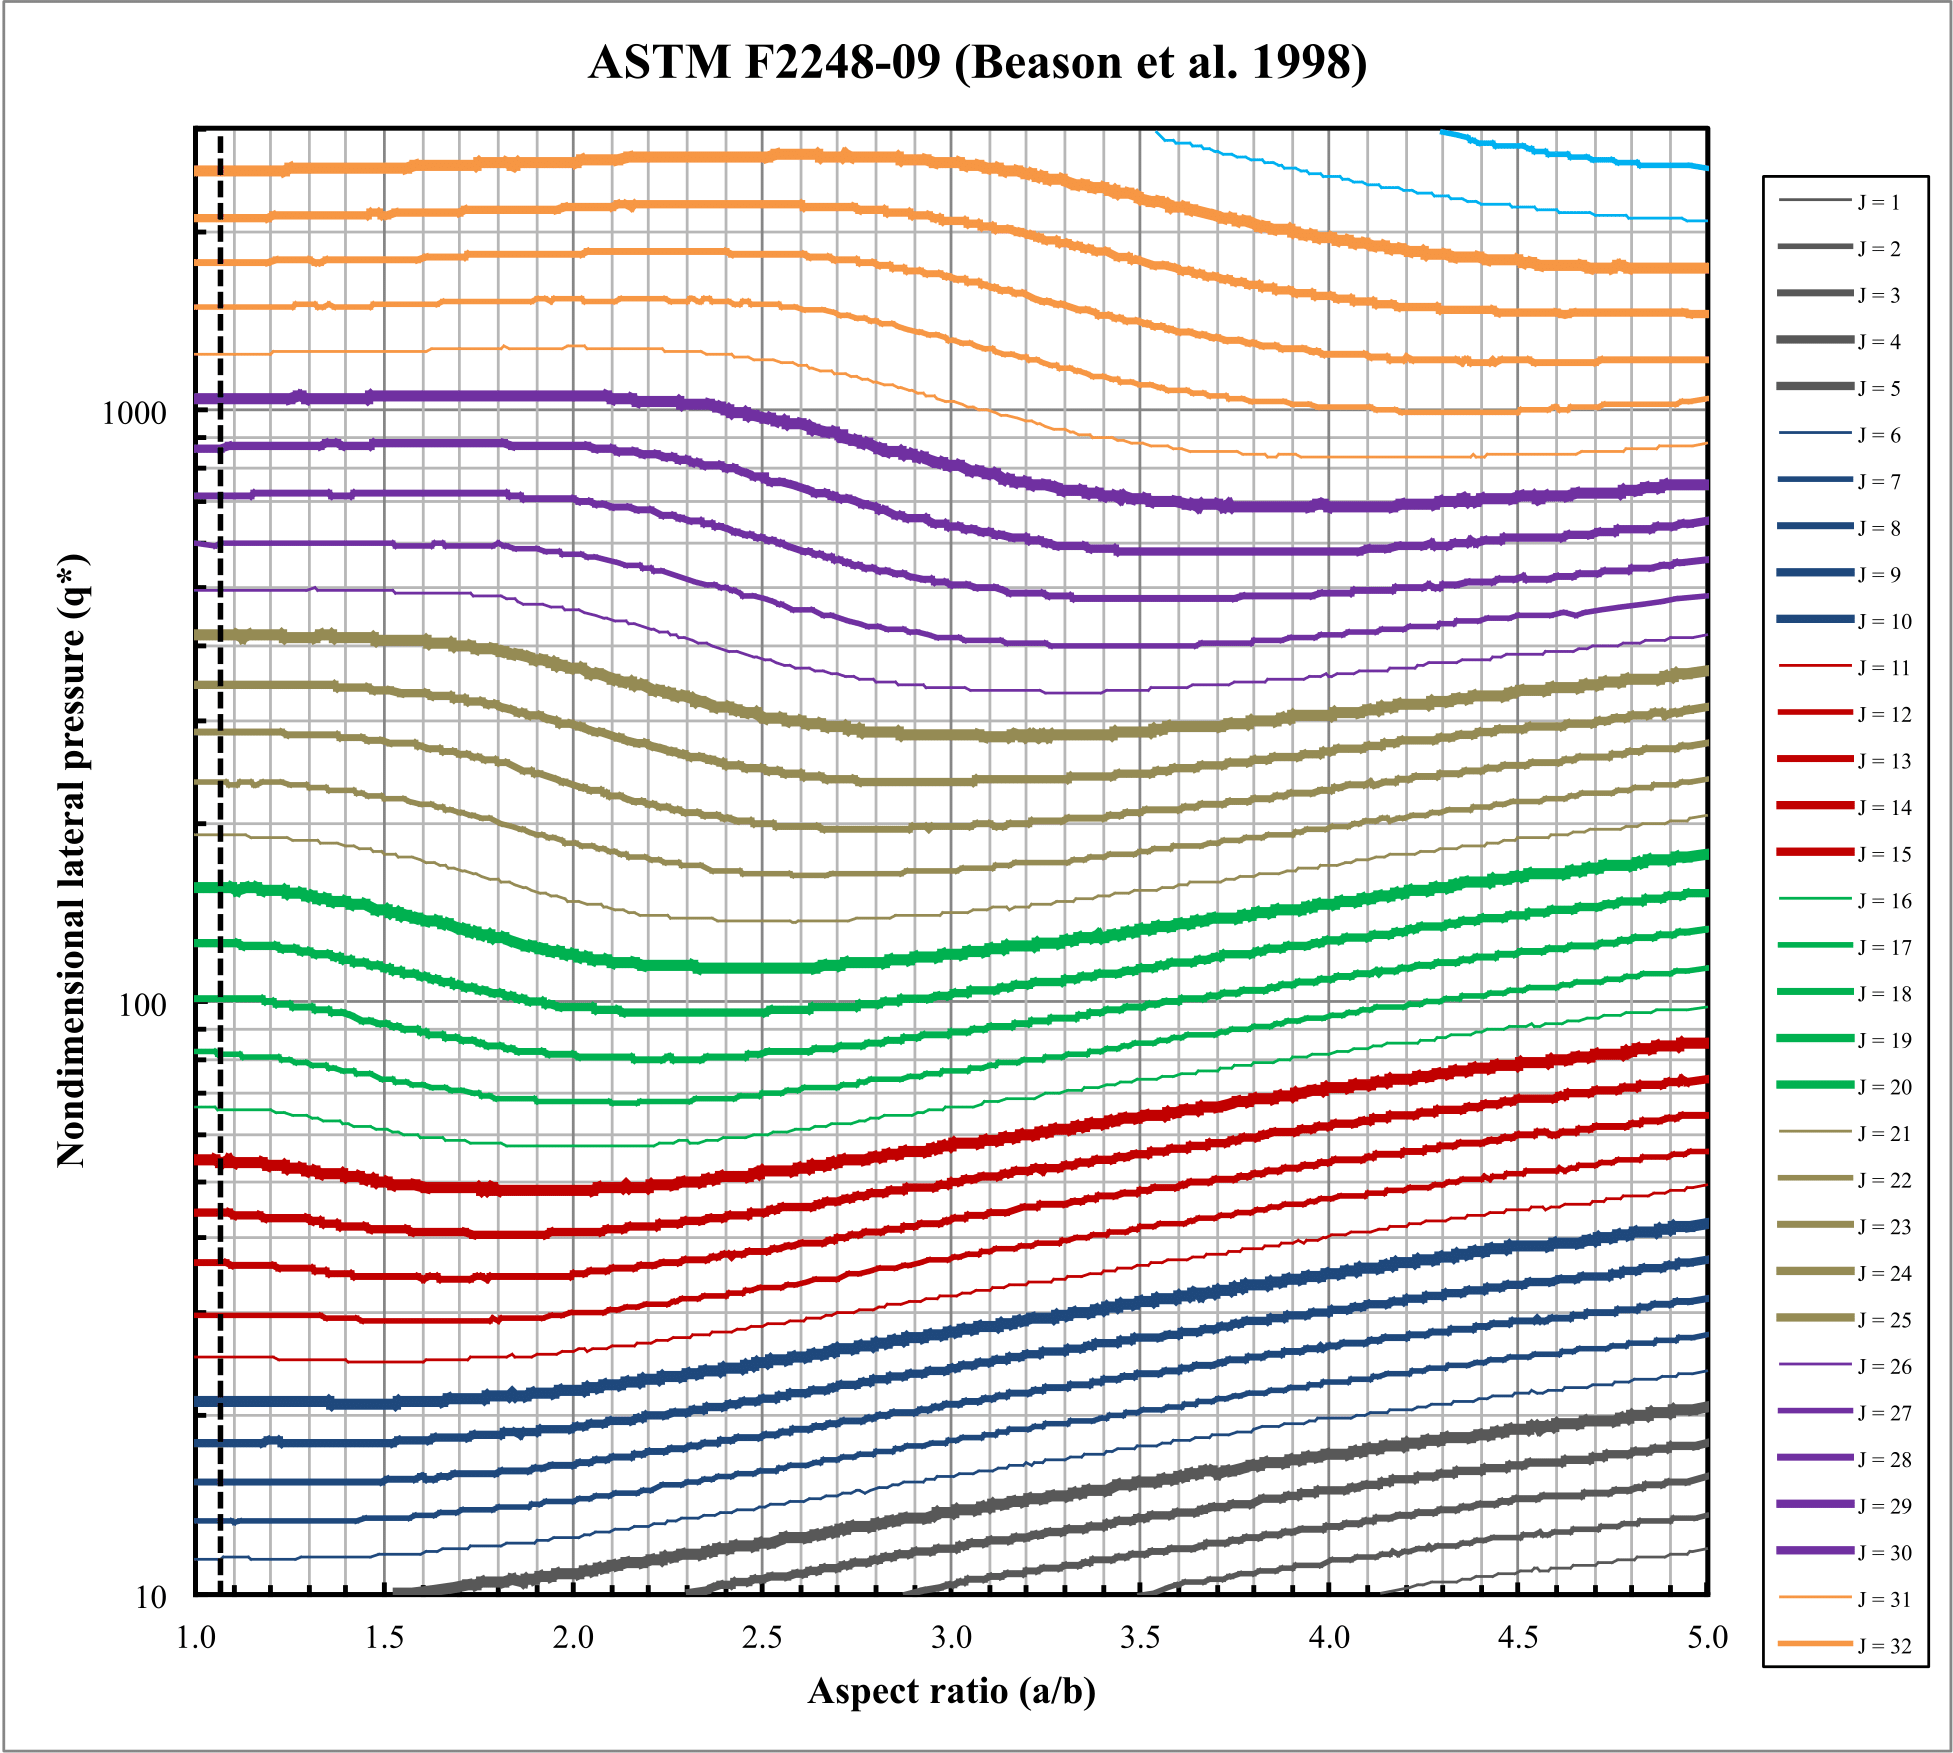
Equation | \[J=\mathit{interpZ}\left(\text{``SDF.txt''},\mathit{AR},\hat{q}\right)\] |
Description | |
Notes |
J is obtained by interpolating from data shown in Fig:dimlessloadVSaspect. AR is defined in DD:aspectRatio. q̂ is defined in IM:dimlessLoad. |
Source | |
RefBy |
Refname | IM:nFL |
---|---|
Label | Non-factored load |
Input |
q̂tol, E, h, a, b |
Output | NFL |
Input Constraints | \[a\gt{}0\] \[0\lt{}b\leq{}a\] |
Output Constraints | |
Equation | \[\mathit{NFL}=\frac{{\hat{q}_{\text{tol}}} E h^{4}}{\left(a b\right)^{2}}\] |
Description | |
Notes |
q̂tol is defined in IM:tolLoad. E comes from A:standardValues. h is defined in DD:minThick and is based on the nominal thicknesses. a and b are the dimensions of the plate, where (a ≥ b). |
Source | |
RefBy |
Refname | IM:dimlessLoad |
---|---|
Label | Dimensionless load |
Input |
q, E, h, GTF, a, b |
Output | q̂ |
Input Constraints | \[a\gt{}0\] \[0\lt{}b\leq{}a\] |
Output Constraints | |
Equation | \[\hat{q}=\frac{q \left(a b\right)^{2}}{E h^{4} \mathit{GTF}}\] |
Description | |
Notes |
q is the 3 second duration equivalent pressure, as given in DD:calofDemand. a and b are the dimensions of the plate, where (a ≥ b). E comes from A:standardValues. h is defined in DD:minThick and is based on the nominal thicknesses. GTF is defined in DD:gTF. |
Source |
astm2009 and campidelli (Eq. 7) |
RefBy |
Refname | IM:tolLoad |
---|---|
Label | Tolerable load |
Input |
AR, Jtol |
Output | q̂tol |
Input Constraints | \[\mathit{AR}\geq{}1\] |
Output Constraints | |
Equation | \[{\hat{q}_{\text{tol}}}=\mathit{interpY}\left(\text{``SDF.txt''},\mathit{AR},{J_{\text{tol}}}\right)\] |
Description | |
Notes |
q̂tol is obtained by interpolating from data shown in Fig:dimlessloadVSaspect. AR is defined in DD:aspectRatio. Jtol is defined in IM:sdfTol. |
Source | |
RefBy |
Refname | IM:sdfTol |
---|---|
Label |
Tolerable stress distribution factor |
Input |
LDF, Pbtol, E, a, b, m, k, h |
Output | Jtol |
Input Constraints | \[0\leq{}{P_{\text{b}\text{tol}}}\leq{}1\] \[a\gt{}0\] \[0\lt{}b\leq{}a\] |
Output Constraints | |
Equation | \[{J_{\text{tol}}}=\ln\left(\ln\left(\frac{1}{1-{P_{\text{b}\text{tol}}}}\right) \frac{\left(a b\right)^{m-1}}{k \left(E h^{2}\right)^{m} \mathit{LDF}}\right)\] |
Description | |
Notes |
Pbtol is entered by the user. a and b are the dimensions of the plate, where (a ≥ b). m, k, and E come from A:standardValues. h is defined in DD:minThick and is based on the nominal thicknesses. LDF is defined in DD:loadDurFactor. |
Source | |
RefBy |
Refname | IM:probOfBreak |
---|---|
Label | Probability of breakage |
Input | B |
Output | Pb |
Input Constraints | |
Output Constraints | \[0\leq{}{P_{\text{b}}}\leq{}1\] |
Equation | \[{P_{\text{b}}}=1-e^{-B}\] |
Description | |
Notes |
B is defined in IM:riskFun. |
Source | |
RefBy |
Refname | IM:calofCapacity |
---|---|
Label | Load resistance |
Input |
NFL, GTF, LSF |
Output | LR |
Input Constraints | |
Output Constraints | |
Equation | \[\mathit{LR}=\mathit{NFL} \mathit{GTF} \mathit{LSF}\] |
Description | |
Notes |
LR is also called capacity. NFL is defined in IM:nFL. GTF is defined in DD:gTF. |
Source | |
RefBy |
Refname | IM:isSafePb |
---|---|
Label | Safety Req-Pb |
Input |
Pb, Pbtol |
Output | isSafePb |
Input Constraints | \[0\leq{}{P_{\text{b}}}\leq{}1\] \[0\leq{}{P_{\text{b}\text{tol}}}\leq{}1\] |
Output Constraints | |
Equation | \[\mathit{isSafePb}={P_{\text{b}}}\lt{}{P_{\text{b}\text{tol}}}\] |
Description | |
Notes |
If isSafePb, the glass is considered safe. isSafePb and isSafeLR (from IM:isSafeLR) are either both True or both False. Pb is defined in IM:probOfBreak. Pbtol is entered by the user. |
Source | |
RefBy |
Refname | IM:isSafeLR |
---|---|
Label | Safety Req-LR |
Input | LR, q |
Output | isSafeLR |
Input Constraints | \[\mathit{LR}\gt{}0\] \[q\gt{}0\] |
Output Constraints | |
Equation | \[\mathit{isSafeLR}=\mathit{LR}\gt{}q\] |
Description | |
Notes |
If isSafeLR, the glass is considered safe. isSafePb (from IM:isSafePb) and isSafeLR are either both True or both False. LR is defined in IM:calofCapacity and is also called capacity. q is the 3 second duration equivalent pressure, as given in DD:calofDemand. |
Source | |
RefBy |
The Data Constraints Table shows the data constraints on the input variables. The column for physical constraints gives the physical limitations on the range of values that can be taken by the variable. The uncertainty column provides an estimate of the confidence with which the physical quantities can be measured. This information would be part of the input if one were performing an uncertainty quantification exercise. The constraints are conservative to give the user of the model the flexibility to experiment with unusual situations. The column of typical values is intended to provide a feel for a common scenario. The auxiliary constants give the values of the specification parameters used in the Data Constraints Table.
Var | Physical Constraints | Software Constraints | Typical Value | Uncert. |
---|---|---|---|---|
a | a > 0 ∧ a ≥ b | dmin ≤ a ≤ dmax | 1.5 m | 10% |
AR | AR ≥ 1 | AR ≤ ARmax | 1.5 | 10% |
b | 0 < b ≤ a | dmin ≤ b ≤ dmax | 1.2 m | 10% |
Pbtol | 0 ≤ Pbtol ≤ 1 | -- | 0.008 | 0.1% |
SD | SD > 0 | SDmin ≤ SD ≤ SDmax | 45 m | 10% |
TNT | TNT > 0 | -- | 1 | 10% |
w | w > 0 | wmin ≤ w ≤ wmax | 42 kg | 10% |
The Data Constraints Table shows the data constraints on the output variables. The column for physical constraints gives the physical limitations on the range of values that can be taken by the variable.
Var | Physical Constraints |
---|---|
Pb | 0 ≤ Pb ≤ 1 |
J | Jmin ≤ J ≤ Jmax |
This section provides the functional requirements, the tasks and behaviours that the software is expected to complete, and the non-functional requirements, the qualities that the software is expected to exhibit.
This section provides the functional requirements, the tasks and behaviours that the software is expected to complete.
Symbol | Description | Units |
---|---|---|
a | Plate length (long dimension) | m |
b | Plate width (short dimension) | m |
g | Glass type | -- |
Pbtol | Tolerable probability of breakage | -- |
SDx | Stand off distance (x-component) | m |
SDy | Stand off distance (y-component) | m |
SDz | Stand off distance (z-component) | m |
t | Nominal thickness t ∈ {2.5,2.7,3.0,4.0,5.0,6.0,8.0,10.0,12.0,16.0,19.0,22.0} | mm |
TNT | TNT equivalent factor | -- |
w | Charge weight | kg |
Symbol | Description | Source | Units |
---|---|---|---|
AR | Aspect ratio | DD:aspectRatio | -- |
E | Modulus of elasticity of glass | A:standardValues | Pa |
GTF | Glass type factor | DD:gTF | -- |
h | Minimum thickness | DD:minThick | m |
k | Surface flaw parameter | A:standardValues | \(\frac{\text{m}^{12}}{\text{N}^{7}}\) |
LDF | Load duration factor | DD:loadDurFactor | -- |
LSF | Load share factor | A:glassLite | -- |
m | Surface flaw parameter | A:standardValues | \(\frac{\text{m}^{12}}{\text{N}^{7}}\) |
SD | Stand off distance | DD:standOffDist | m |
td | Duration of load | A:standardValues | s |
Symbol | Description | Source | Units |
---|---|---|---|
AR | Aspect ratio | DD:aspectRatio | -- |
B | Risk of failure | IM:riskFun | -- |
GTF | Glass type factor | DD:gTF | -- |
h | Minimum thickness | DD:minThick | m |
isSafeLR | 3 second load equivalent resistance safety requirement | IM:isSafeLR | -- |
isSafePb | Probability of glass breakage safety requirement | IM:isSafePb | -- |
J | Stress distribution factor (Function) | IM:stressDistFac | -- |
Jtol | Tolerable stress distribution factor | IM:sdfTol | -- |
LR | Load resistance | IM:calofCapacity | Pa |
NFL | Non-factored load | IM:nFL | Pa |
Pb | Probability of breakage | IM:probOfBreak | -- |
q̂ | Dimensionless load | IM:dimlessLoad | -- |
q̂tol | Tolerable load | IM:tolLoad | -- |
This section provides the non-functional requirements, the qualities that the software is expected to exhibit.
This section lists the likely changes to be made to the software.
This section lists the unlikely changes to be made to the software.
The purpose of the traceability matrices is to provide easy references on what has to be additionally modified if a certain component is changed. Every time a component is changed, the items in the column of that component that are marked with an "X" should be modified as well. Tab:TraceMatAvsA shows the dependencies of the assumptions on each other. Tab:TraceMatAvsAll shows the dependencies of the data definitions, theoretical models, general definitions, instance models, requirements, likely changes, and unlikely changes on the assumptions. Tab:TraceMatRefvsRef shows the dependencies of the data definitions, theoretical models, general definitions, and instance models on each other. Tab:TraceMatAllvsR shows the dependencies of the requirements and goal statements on the data definitions, theoretical models, general definitions, and instance models.
The purpose of the traceability graphs is also to provide easy references on what has to be additionally modified if a certain component is changed. The arrows in the graphs represent dependencies. The component at the tail of an arrow is depended on by the component at the head of that arrow. Therefore, if a component is changed, the components that it points to should also be changed. Fig:TraceGraphAvsA shows the dependencies of assumptions on each other. Fig:TraceGraphAvsAll shows the dependencies of data definitions, theoretical models, general definitions, instance models, requirements, likely changes, and unlikely changes on the assumptions. Fig:TraceGraphRefvsRef shows the dependencies of data definitions, theoretical models, general definitions, and instance models on each other. Fig:TraceGraphAllvsR shows the dependencies of requirements and goal statements on the data definitions, theoretical models, general definitions, and instance models. Fig:TraceGraphAllvsAll shows the dependencies of dependencies of assumptions, models, definitions, requirements, goals, and changes with each other.
For convenience, the following graphs can be found at the links below:
This section contains the standard values that are used for calculations in GlassBR.
Symbol | Description | Value | Unit |
---|---|---|---|
ARmax | maximum aspect ratio | 5 | -- |
dmax | maximum value for one of the dimensions of the glass plate | 5 | m |
dmin | minimum value for one of the dimensions of the glass plate | 0.1 | m |
E | modulus of elasticity of glass | 71.7⋅109 | Pa |
Jmax | maximum value for the stress distribution factor | 32 | -- |
Jmin | minimum value for the stress distribution factor | 1 | -- |
k | surface flaw parameter | 28.6⋅10-54 | \(\frac{\text{m}^{12}}{\text{N}^{7}}\) |
LSF | load share factor | 1 | -- |
m | surface flaw parameter | 7 | \(\frac{\text{m}^{12}}{\text{N}^{7}}\) |
SDmax | maximum stand off distance permissible for input | 130 | m |
SDmin | minimum stand off distance permissible for input | 6 | m |
td | duration of load | 3 | s |
wmax | maximum permissible input charge weight | 910 | kg |
wmin | minimum permissible input charge weight | 4.5 | kg |
This appendix holds the graphs (Fig:demandVSsod and Fig:dimlessloadVSaspect) used for interpolating values needed in the models.